

Audits Dashboard
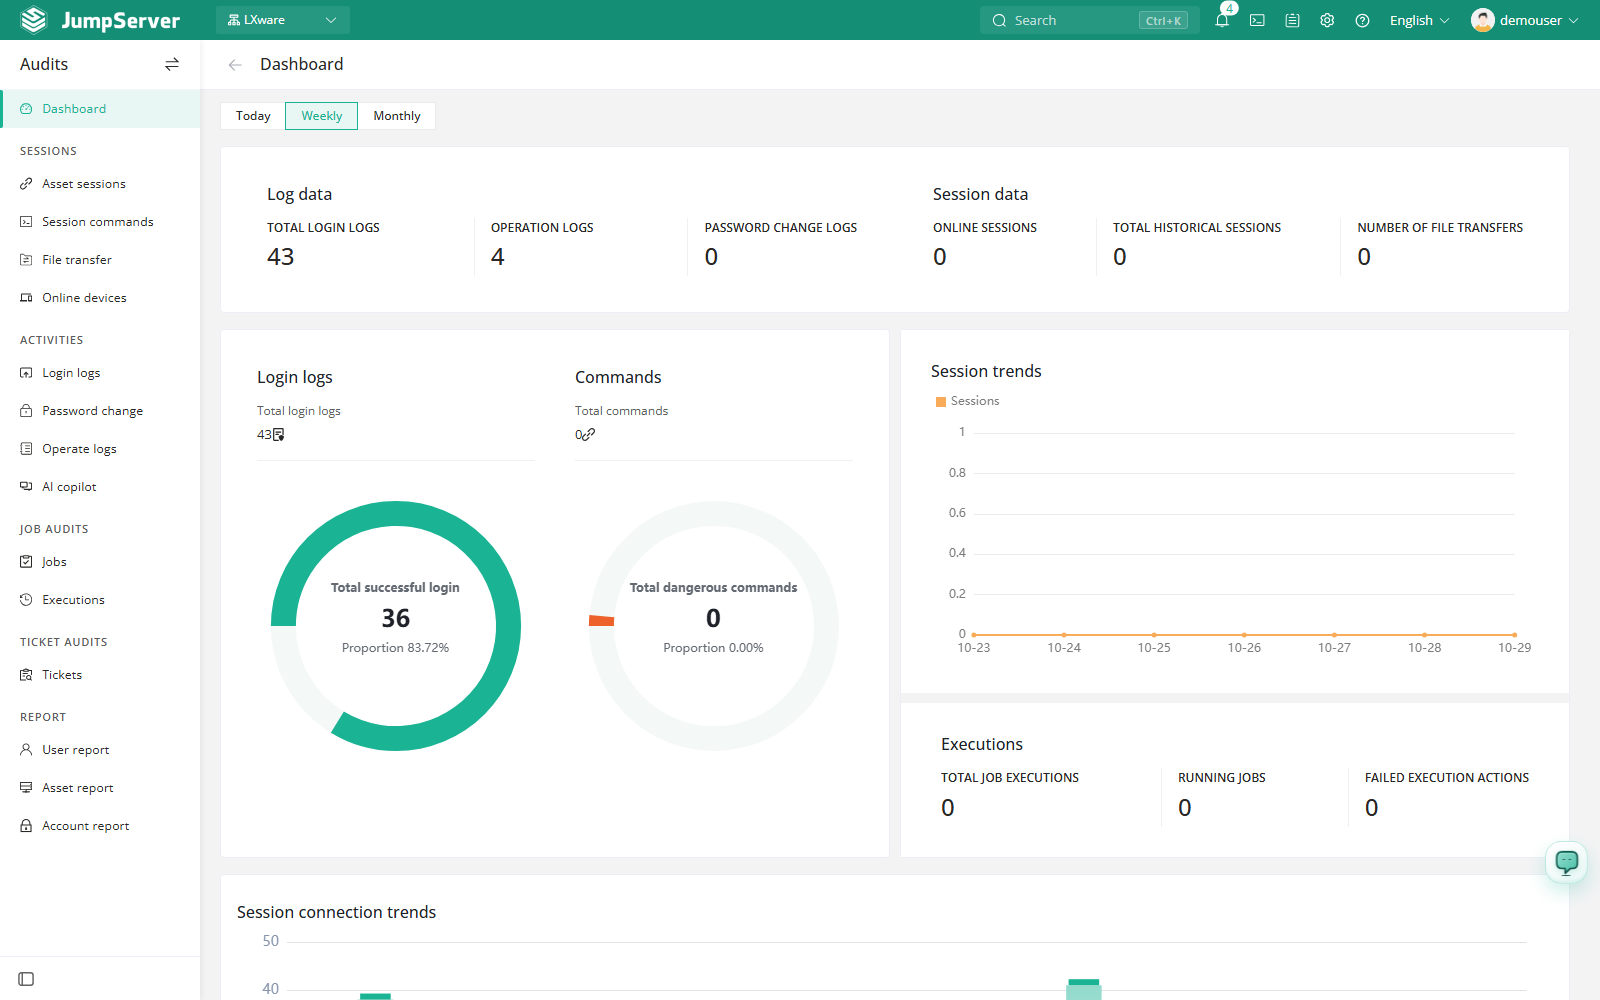
The Audits Dashboard is the landing page of the Audits workspace. It summarizes authentication, session, command, file-transfer, and job activity for the organization selected in the top navigation bar, so auditors and administrators can spot unusual volume or failed activity before opening the record-level pages.
Open the dashboard
Switch the workspace to Audits from the workspace switcher in the top navigation bar.
Select Dashboard in the left sidebar.
Choose Today, Last 7 days, or Last 30 days at the top of the page. The selection is remembered in the current browser.
Counters
The top cards summarize the selected time range.
Charts
- Login logs compares successful and failed sign-ins as a donut chart and shows the total number of login records. Use Login Logs when you need to see the reason for a failure.
- Commands compares dangerous commands with other recorded commands and shows the total number of command records. Open Session Commands to inspect the command text and output.
- Session trends plots the number of sessions per day as a line chart.
- Session connection trends plots daily connections as a column chart.
If a chart has no data in the selected range, it still shows its axes and legend but no series. This usually means that there is nothing to display rather than a rendering problem.
Drill down
The counters are summaries only. Use the matching list page when you need individual records:
- Asset Sessions and File Transfer
- Login Logs, Password Change Logs, and Operate Logs
- Job Executions
- User Reports, Asset Reports, and Account Reports
Notes
The dashboard shows data from the organization selected in the top navigation bar, and each metric requires the matching audit permission. If a card is missing or empty even though activity exists, check the organization selection and your role permissions.