

System Tools
System Tools provides a set of network diagnostics that run from the JumpServer host. Use it to check whether an asset is reachable before you troubleshoot a connection, and to confirm which port or route is failing.
Overview
Run a diagnostic
In the right area of the top navigation bar, click .

In the left menu, click System Tools.
Select the tool tab you need.
Enter the target address, and a port when the tool requires one.
Run the command and review the output. The server time banner at the top of the page shows the clock used by the command.
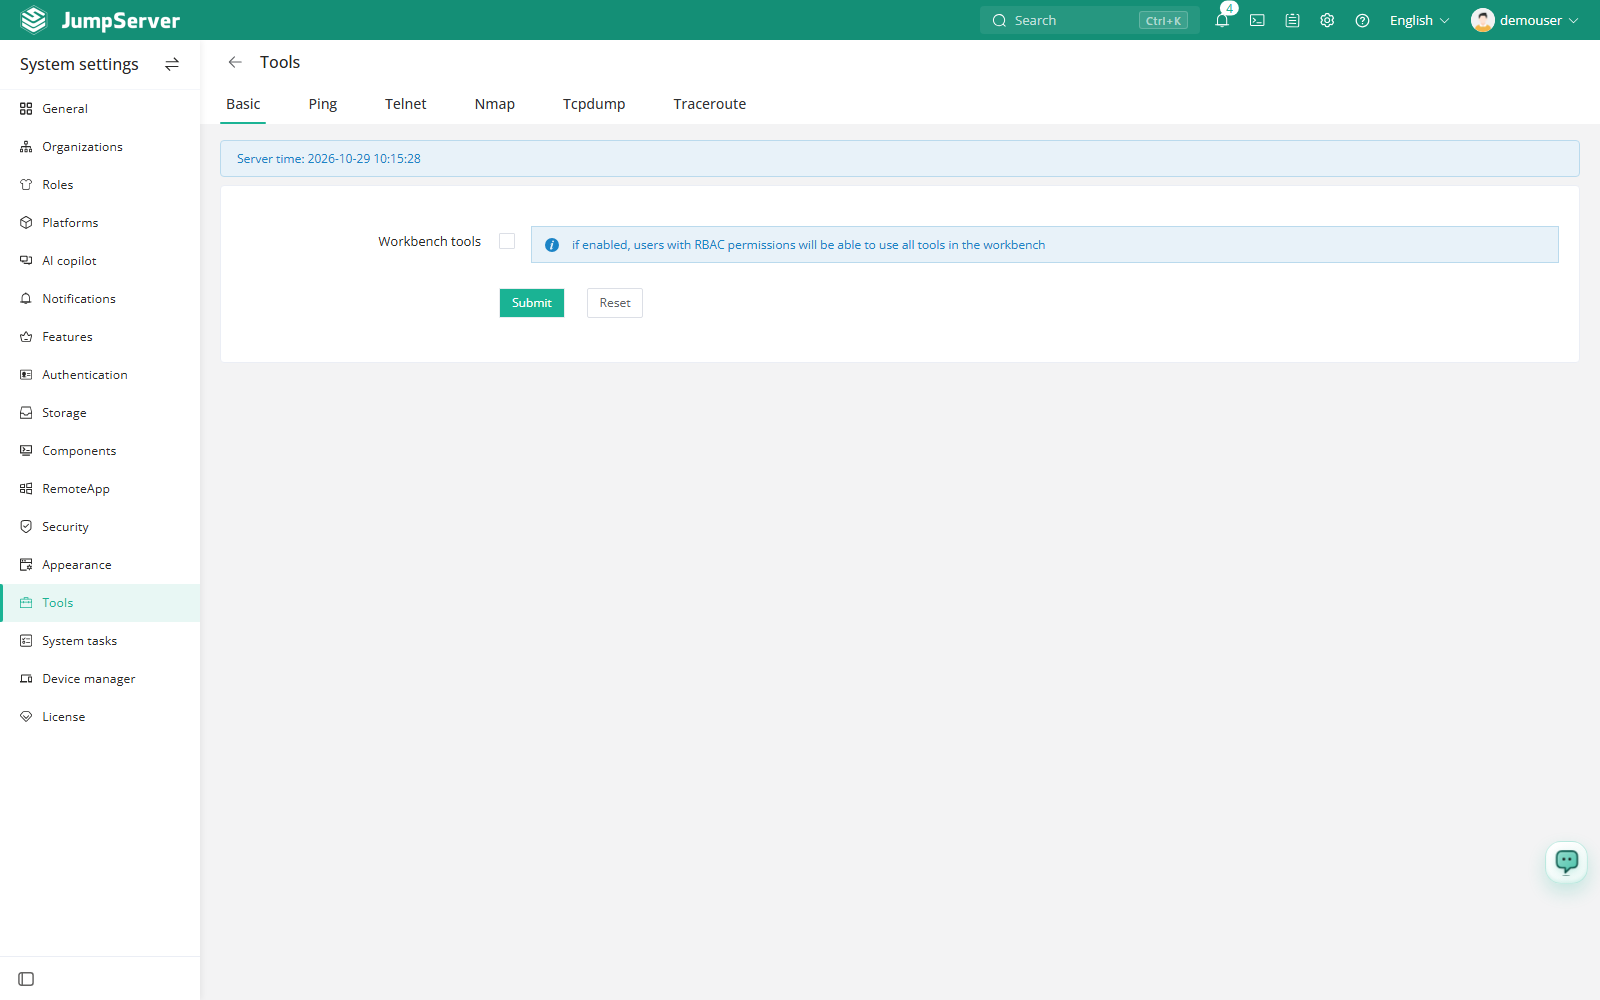
Enable the tools in the workbench
The Basic tab contains a single option, Tools in the workbench. When it is enabled, the same diagnostics are also available to users from the Workbench tools page, which lets operators check connectivity without entering System Settings.
Open the Basic tab.
Select Tools in the workbench.
Click Submit.
The commands run on the JumpServer server, not in the user's browser. Traffic therefore originates from the JumpServer host network and is subject to the same routing, firewall, and proxy rules as any other JumpServer connection. Tools that are not installed in the runtime image, or that lack the required kernel capabilities, are not available even when the feature is enabled.