

Asset Reports
Audit reports require JumpServer Enterprise Edition. Raw session and log evidence remains available according to your deployment configuration.
Asset Reports summarizes the asset inventory and how users connect to it. Use it to track asset growth, confirm which assets are connectable, and see how users reach assets and which operating systems they log in to.
Open the page from Audits > Report > Asset Reports.
Report types
- Asset statistics report — inventory overview with asset type distribution and growth trend.
- Asset activity report — session-based view of asset usage, with user and asset activity, login entry points, protocols, operating systems, and login trends.
Prerequisites
- A valid enterprise license. Without a license, the Report area is not available.
- An audit role with the
rbac.view_assetstatisticsreportorrbac.view_assetactivityreportpermission.
Read the asset statistics report
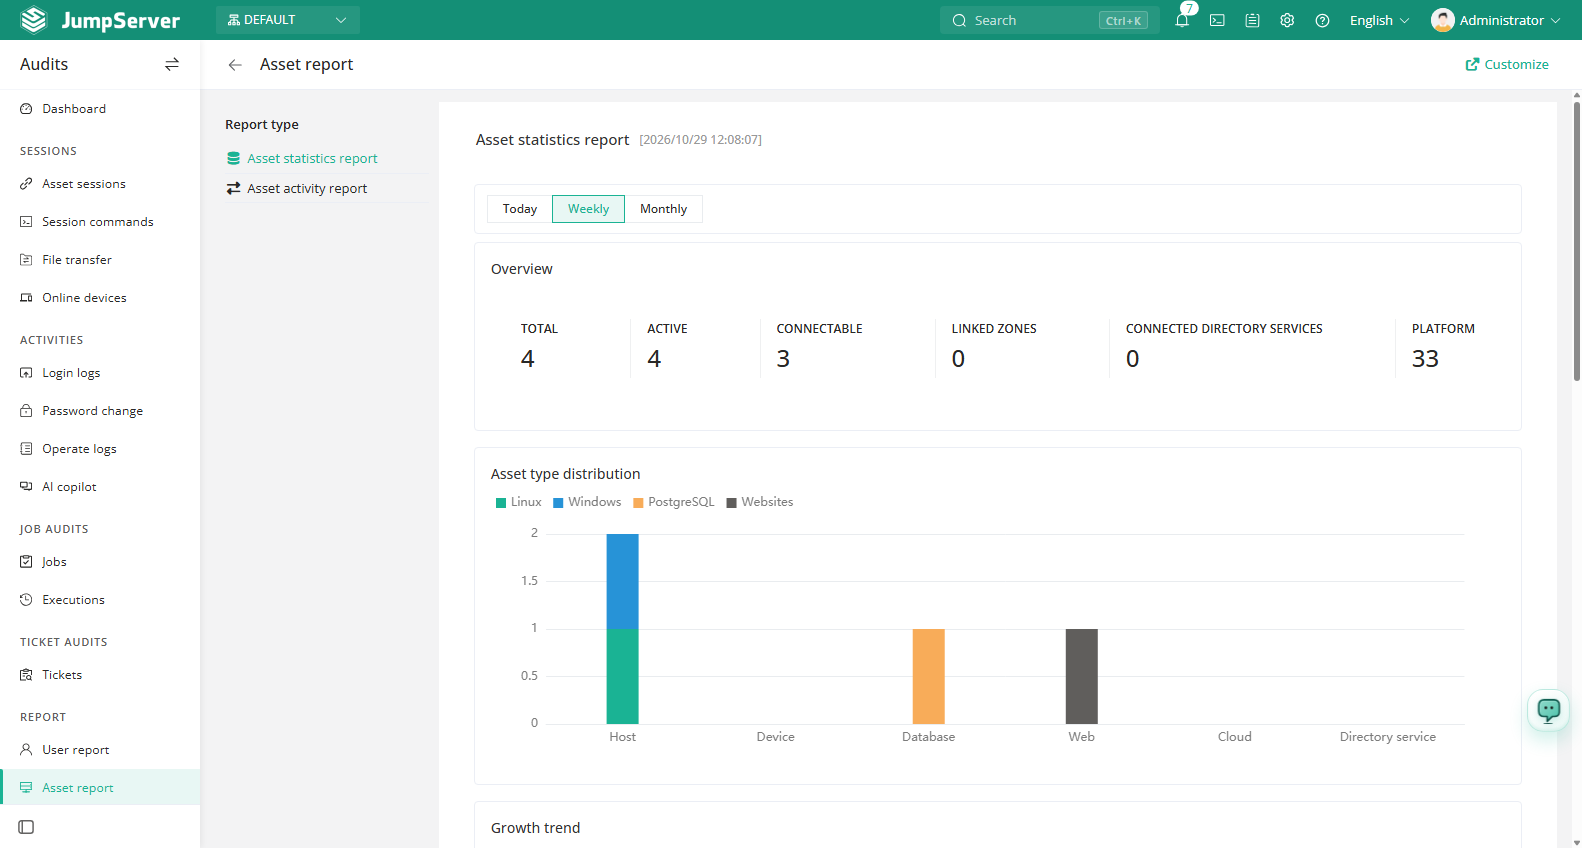
Select Asset statistics report in the left panel.
Choose Today, Last 7 days, or Last 30 days.
Review the overview counters: total assets, active, connectable, linked domains, connected directory services, and platforms.
Read the Asset type distribution chart and the Growth trend chart.
Read the asset activity report
Select Asset activity report to see usage rather than inventory. The overview shows sessions, assets, and users in the range. Charts include user/asset activity, distribution of asset login methods, remote login protocol usage distribution, operating system distribution of login assets, and asset login trends.
Field reference
Notes
Customize controls which charts and tables the report displays. The statistics report reflects inventory, while the activity report reflects sessions in the selected range, so the two can legitimately disagree.