
Console Dashboard
The Console Dashboard is the landing page of the Console workspace. It brings together the live state of the current organization: sessions that are running now, how many users and assets exist, which assets were active today, and the accounts and assets that were logged in to most often. Use it as the starting point for daily operations, then open the detailed lists when a number looks wrong.
Open the page from Console > Dashboard.
Overview
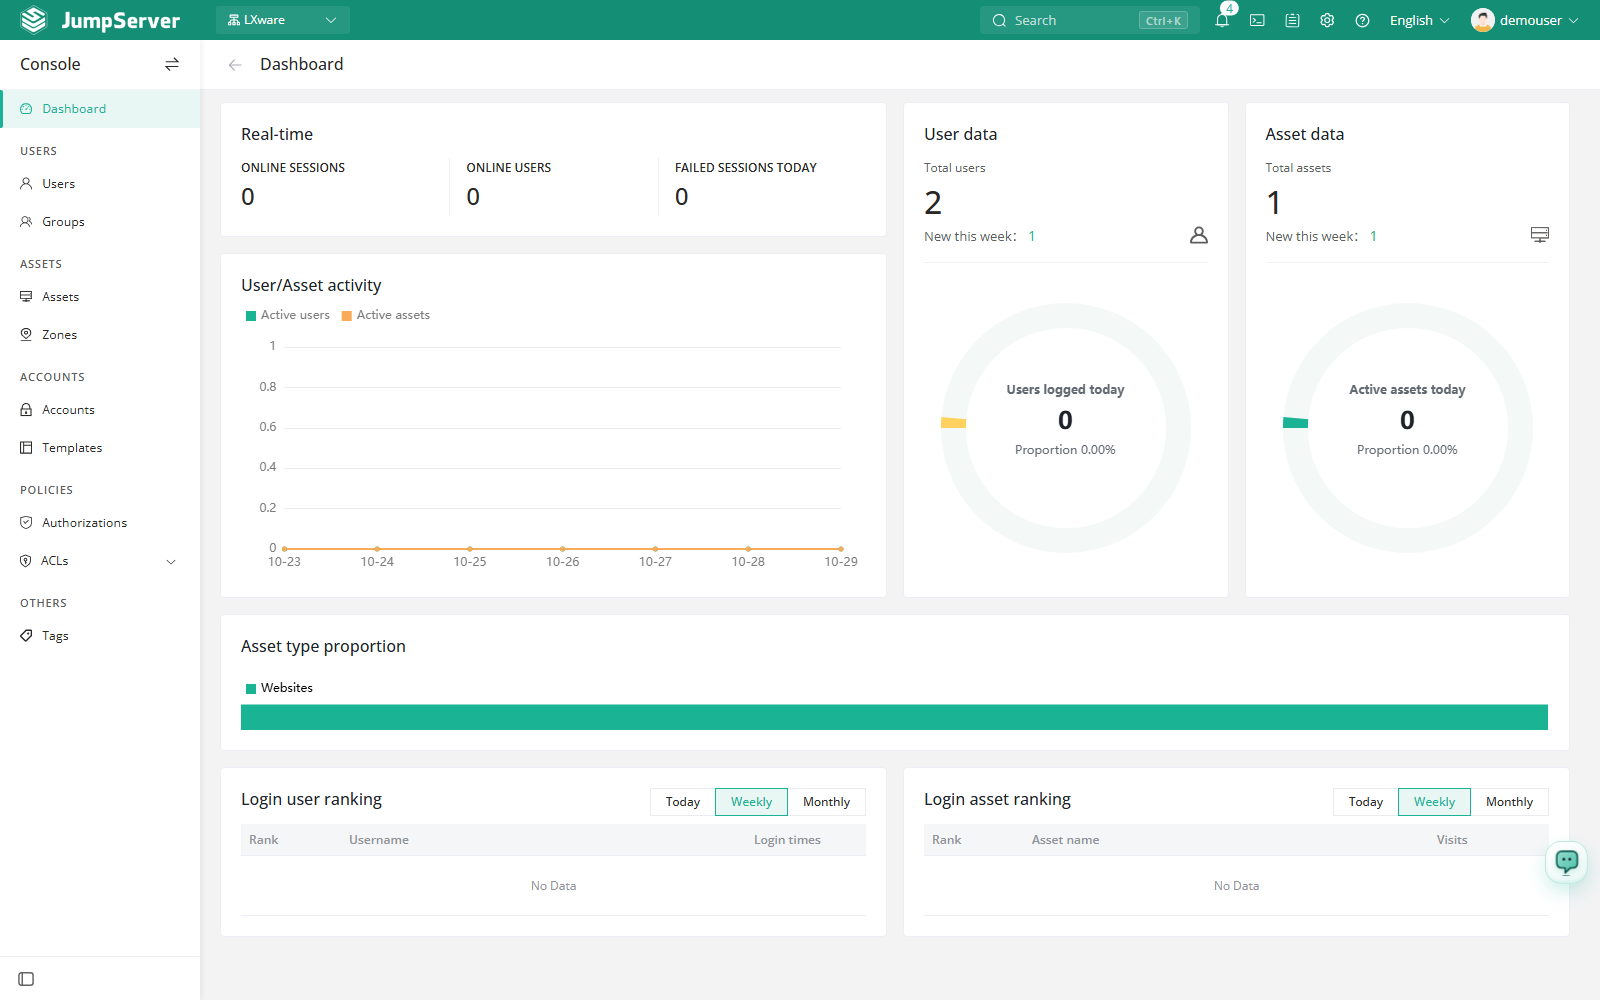
The page is organized into six areas:
- Real-time data: the number of online sessions, the number of users in those sessions, and the number of failed connections today.
- User data: total users, users added this week, today's login users, and their share of all users.
- Asset data: total assets, assets added this week, today's active assets, and their share of all assets.
- User and asset activity: a trend line comparing active users with active assets over time, to show usage peaks and quiet periods.
- Asset type distribution: the share of assets by platform or type, shown as a horizontal bar chart.
- Login rankings: the accounts with the most logins and the assets with the most access, each with a selectable time window.
What each area shows
Change the ranking period
Scroll to Login account ranking or Login asset ranking at the bottom of the page.
Select Today, Last 7 days, or Last 30 days above the table.
The table refreshes for the selected window. The account ranking lists rank, username, and login count; the asset ranking lists rank, asset name, and access count.
Investigate from a tile
- A spike in Failed connections today is usually a credential, network, or connectivity problem. Compare it with Login Logs.
- Unexpected online sessions can be inspected, recorded, or terminated in Asset Sessions.
- Assets with no recent activity often mean missing or stale Authorizations, or accounts that were never added to the asset.
- Users who never sign in are easy to find with the Never logged in filter on the Users page.
All figures follow the organization selected in the organization switcher. If the numbers look unexpectedly small, confirm that you are viewing the intended organization. Values change as users sign in, connect, and disconnect, so they can differ from reports that aggregate historic audit records.