
For AI agents: the complete documentation index is available at https://www.jumpserver.com/docs/llms.txt, the full documentation bundle is available at https://www.jumpserver.com/docs/llms-full.txt, and this page is available as Markdown at https://www.jumpserver.com/docs/operations/troubleshooting.md.
๐ŸŽ‰ JumpServer v5.1.1 is available. See what's new โ†’

Troubleshooting

Most operational problems show up as a component that will not start, a page that returns an error, or a connection that fails. Work from the outside in: confirm the service state, read the component logs, then check the configuration the failing component depends on. This page lists the first checks and the most common causes.

First checks

./jmsctl.sh status
./jmsctl.sh tail

Then confirm that Core is healthy:

curl -s http://127.0.0.1/api/health/

/api/health/, /koko/health/, and /lion/health/ return the component state and are also what a load balancer should check.

Where the logs are

Component logs are written under VOLUME_DIR, /data/jumpserver by default:

ComponentContainerLog directory
Corejms_core/data/jumpserver/core/data/logs
Celeryjms_celery/data/jumpserver/core/data/logs
KoKojms_koko/data/jumpserver/koko/data/logs
Chenjms_chen/data/jumpserver/chen/data/logs
Razorjms_razor/data/jumpserver/razor/data/logs
Magnusjms_magnus/data/jumpserver/magnus/data/logs
Webjms_web/data/jumpserver/nginx/data/logs

Core writes jumpserver.log, gunicorn.log, drf_exception.log, and unexpected_exception.log. Read the files directly, or use Docker:

tail -f /data/jumpserver/core/data/logs/jumpserver.log
docker logs --since 30m jms_core

The detail level is controlled by LOG_LEVEL. docker logs output disappears when the container is recreated, so copy important log files aside before an upgrade.

Common problems

SymptomWhat to check
Web UI returns 400 or 403DOMAINS must contain the exact host or IP users open in the browser; restart after editing
Web UI returns 502 or 504 behind a proxyProxy health checks, WebSocket upgrade headers, and the backend port
Services do not start./jmsctl.sh status, docker ps, and the Core log; check disk space under VOLUME_DIR
Asset connection failsAuthorization to the asset and account, account secret validity, connectivity test, platform protocol settings, and the zone gateway if the asset is behind one
Web Terminal or web assets do not loadKoKo health, port 2222 for SSH client access, and port 5001 for the web proxy
Login fails after enabling MFAServer time drift (configure NTP) and the user's MFA secret; an administrator can reset MFA
Database or Redis connection errorsDB_USE_SSL / REDIS_USE_SSL and certificate files, service availability, and credentials
Recordings cannot be playedVideo Worker state for graphical sessions, storage connectivity, and free space on VOLUME_DIR
Jobs or discovery tasks keep failingTarget host reachability, account permissions on the target, and the task log

Use the audit trail

For user or administrator reports, correlate the time of the issue with the audit records in Audits > Operation logs, Login logs, and Asset sessions. The operation log shows who changed which object, while the session record shows what happened during the connection.
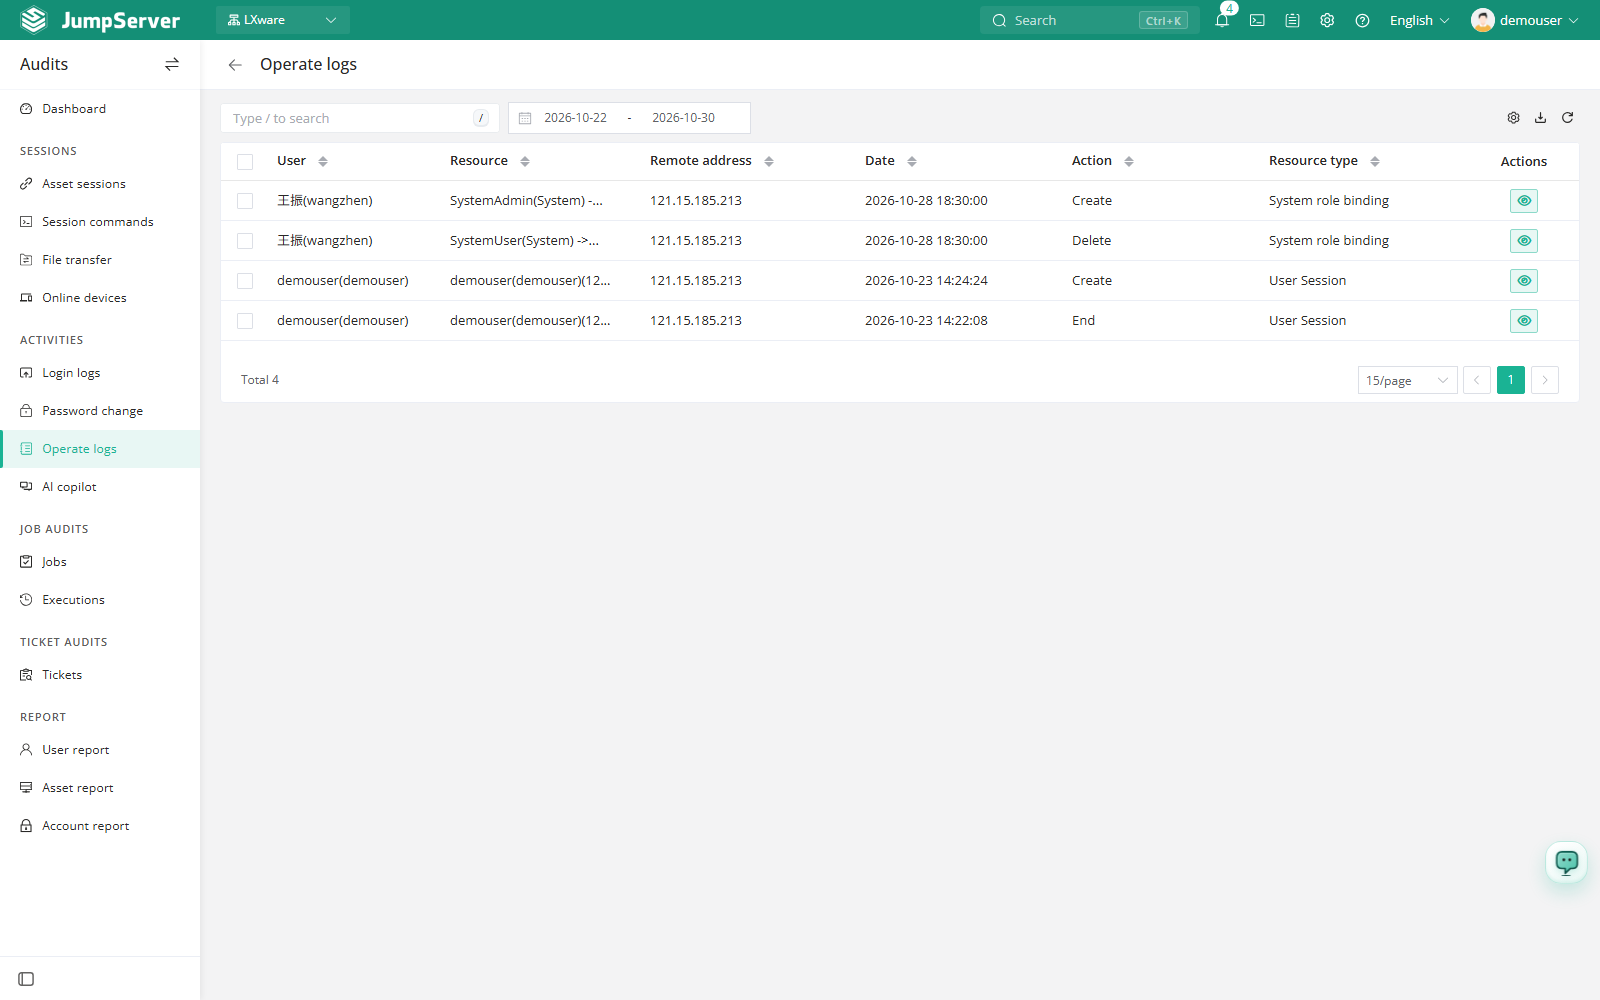
Figure 1: Operation logs in Audits, used to correlate changes with reported issues.

Before contacting support

Collect the following in one archive:

  1. Output of ./jmsctl.sh status and ./jmsctl.sh --help.
  2. The JumpServer version from the UI or the installer output.
  3. Core, KoKo, and web logs around the failure time.
  4. The browser error, the failing URL, and the user, asset, and time involved.
  5. A screenshot of the failing page, without secrets.

See the Client documentation page for connection-specific issues.