

User Reports
Audit reports require JumpServer Enterprise Edition. Raw session and log evidence remains available according to your deployment configuration.
User Reports analyzes how users sign in to JumpServer and how their passwords change over time. The report is chart-first: choose a report type, set the time range, and read the overview counters, charts, and ranking tables.
Open the page from Audits > Report > User Reports.
Report types
The left panel lists the available reports for this category:
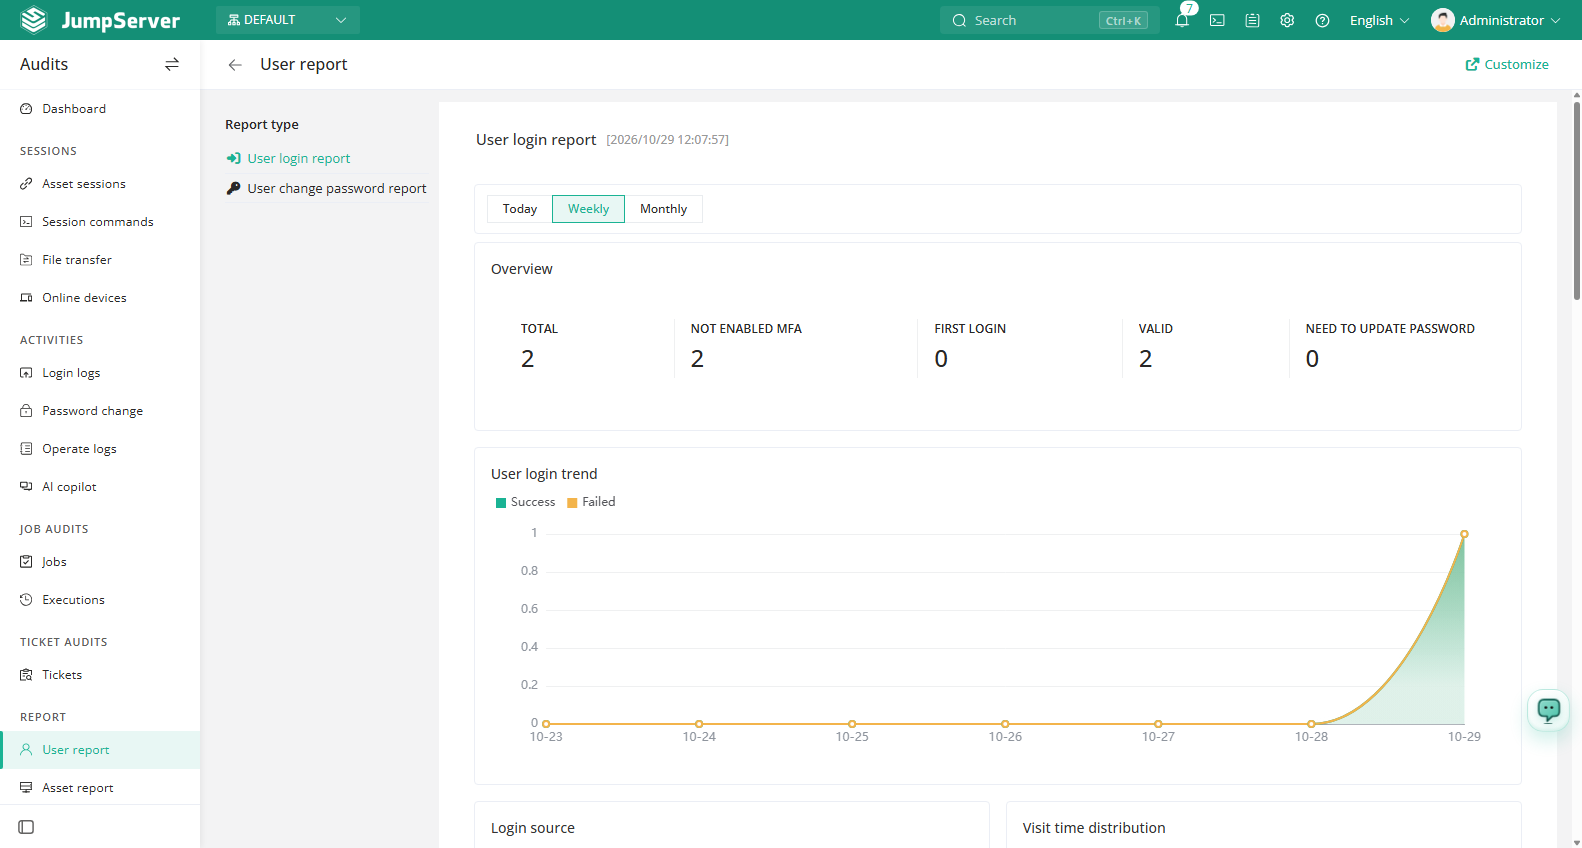
- User login report — overview of the user base and sign-in activity, with success and failure trends, login sources, visit-time distribution, and login methods.
- User change password report — password change totals, a change trend, and rankings of target users and operating users.
Prerequisites
- A valid enterprise license. Without a license, the Report area is not available.
- An audit role with the
rbac.view_userloginreportorrbac.view_userchangepasswordreportpermission.
Read the user login report
Select User login report in the left panel.
Choose Today, Last 7 days, or Last 30 days.
Review the Overview counters: total users, MFA not enabled, first login, valid, face vector, and need to update password.
Read the charts: user login trend (success and failure), login source, visit time distribution, and login method statistics.
Read the user change password report
Select User change password report and review the Overview counters for total changes, target users, and operators. The User modification trends chart shows password changes over time, and the ranking tables list the most frequently modified users and the most active operators.
Field reference
Notes
Customize controls which charts and tables the report displays, while the range switch controls the reporting period. Compare like-for-like periods when you investigate a change in sign-in volume.